 LinceCAD
Contour lines from a LAS/LAZ point cloud in DWG
The screenshots show the Spanish interface; commands and options are given as they appear in the English version of the program.
LiDAR flights produce point clouds with millions of ground elevations, in LAS files or in their compressed version, LAZ. In Spain, the National Aerial Orthophotography Plan (PNOA) publishes LiDAR point clouds of the country in the CNIG Download Center (Centro de Descargas del CNIG). To bring that terrain into a drawing, you need to triangulate it (a DTM, or TIN) and derive the contour lines from it. In LinceCAD the three steps are on the Topography tab, and the result stays in the DWG.
What you need
- A
.lasor.lazfile. Reading them, LASzip included, is built into the program. - The drawing's coordinate system, set with
GEOGRAPHICLOCATION. For PNOA it is ETRS89 / UTM in the zone of the tile, which appears in the file name:H30is zone 30 (EPSG:25830),H29zone 29 andH31zone 31. - If the file is not yours, its terms of use. PNOA LiDAR point clouds belong to the Instituto Geográfico Nacional, under the CC BY 4.0 license: they can be used citing the source.
Step 1: import the point cloud with POINTCLOUD
- Set the drawing's system with
GEOGRAPHICLOCATION(for example,25830) and create a layer for the points, for exampleCLOUD. - Type
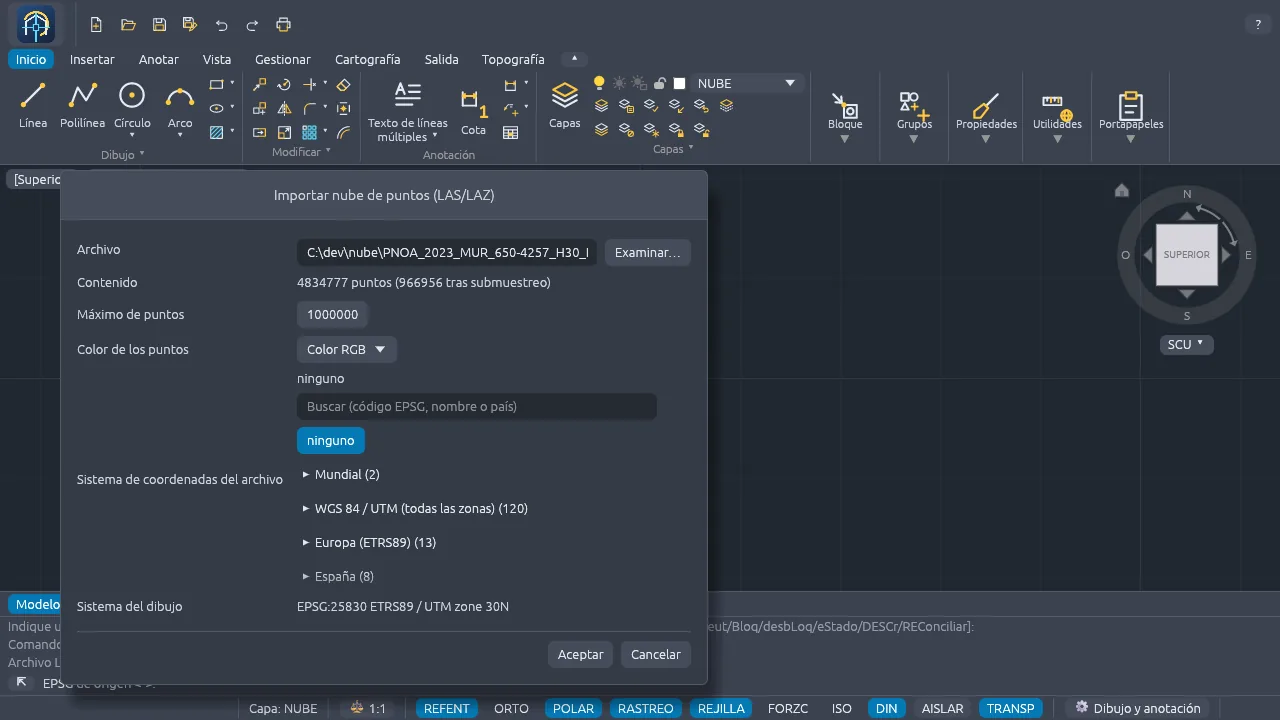
POINTCLOUDor click Import point cloud on the Topography tab, Points group. - Choose the file with Browse…. The dialog box shows how many points it has and how many will remain after subsampling.
- Set Maximum points (1,000,000 by default). If the file has more, 1 out of every N points is kept, spread across the whole cloud.
- Choose the Point colour: the layer's, the flight's RGB, intensity, class or elevation.
- Check the File coordinate system: if the file includes one, the points are reprojected to the drawing's system; if it shows “none”, choose it by hand, or leave it like that when the file is already in the drawing's system. Click OK.
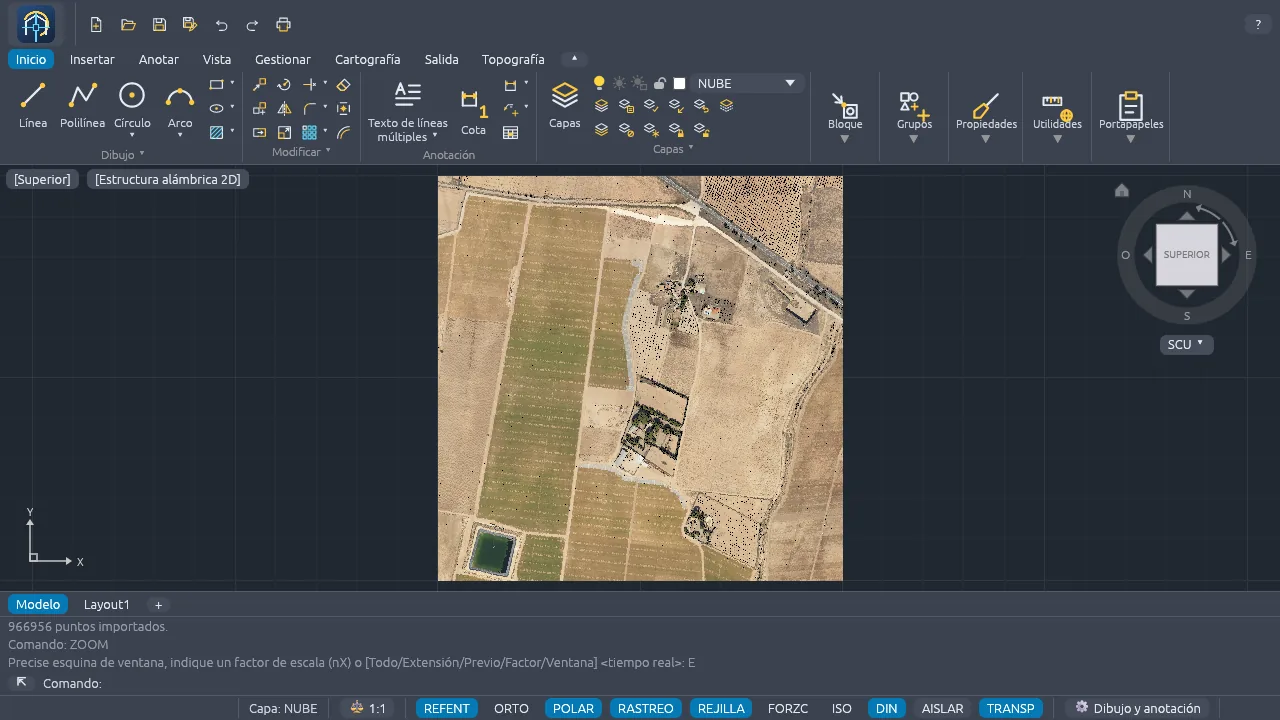
Each point comes in as a normal DWG point object, with its elevation, on the current layer. It shows in the 2D view and in the 3D view.
Step 2: create the DTM
Create a layer for the surface (TIN), type SURFACE or click Surface
(TIN) in the Terrain group, and select the points. The command then asks for:
- Breaklines: polylines or lines that become edges of the mesh (top and toe of a slope, edge of a wall). Enter, none.
- Outer boundary: a closed polyline; the triangles outside it are discarded.
- Holes: gaps with no surface, such as a building or a pond.
- Maximum edge length: removes the triangles on the edge with longer sides, so that distant points are not joined. 0, no limit.
The triangulation is Delaunay and is saved as a polyface mesh, which any DWG program reads. Since the format
allows at most 32,767 vertices or faces per mesh, a larger DTM is saved as several meshes in strips, which are
selected and edited as one. The constraints are saved with the mesh, so that it can be edited later with
EDITSURFACE.
Step 3: draw the contour lines
Type CONTOUR or click Contours and select the surface (if the points are on another
layer, freeze it first so you do not select them at the same time). In the Contours dialog box,
or on the command line, specify:
- The interval between contours.
- How often a contour is an index contour (0, none).
- The smoothing: None (the contours follow the triangles), Polyline or Spline. Smoothing is done on the surface, not contour by contour, so two neighboring contours do not cross.
- The spacing in meters between labels on the index contours (0, no labels).
The contours are polylines (or splines) at their elevation: the intermediate ones on the CN_FINA
layer and the index ones on CN_MAESTRA. The labels read from left to right and break the contour,
instead of covering it with a mask, so that they look the same in any program. If the surface has breaklines, the
contours bend at them.
A real example: a PNOA tile
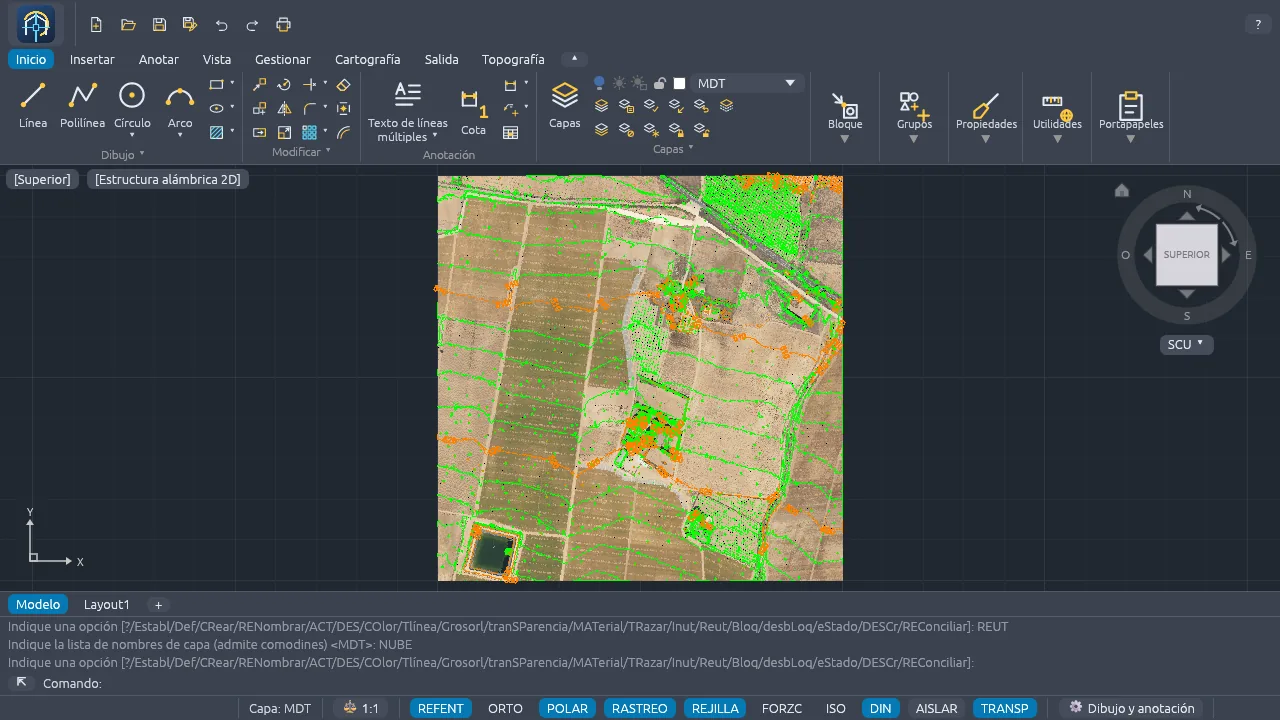
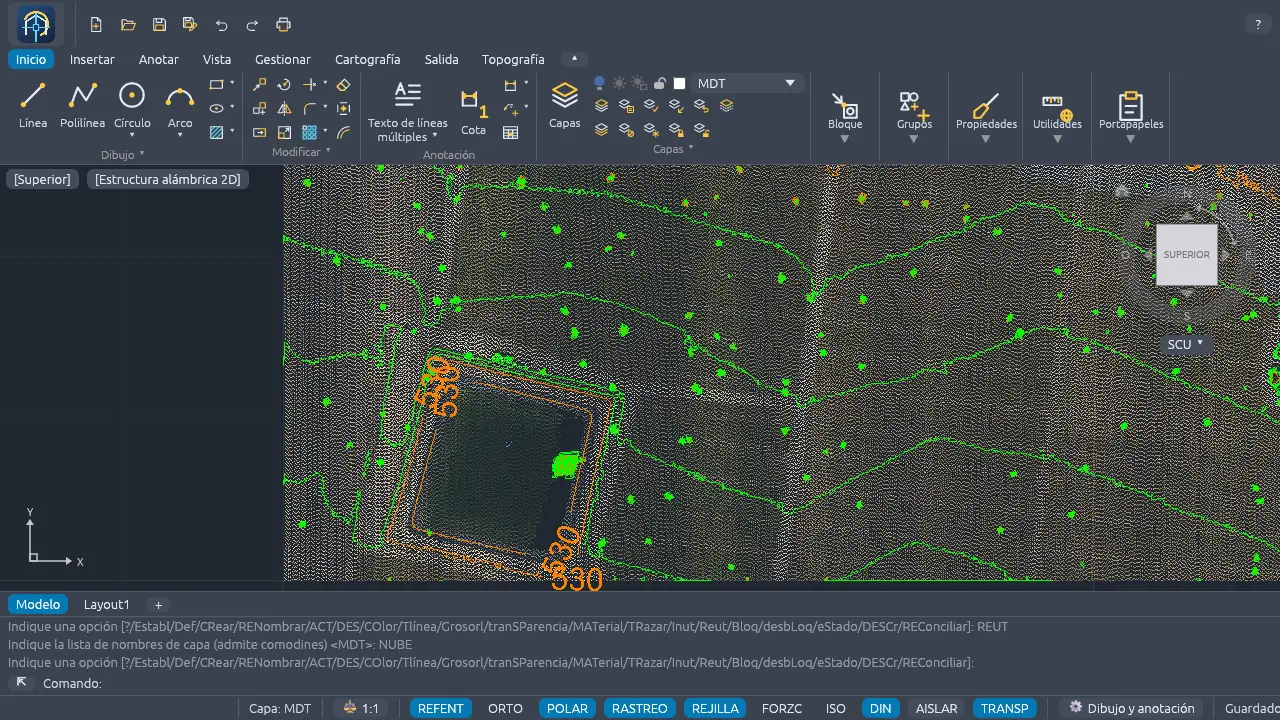
We made the screenshots with a 1 × 1 km 2023 PNOA LiDAR tile in the Region of Murcia: the DTM with the default values and the contours every 2 m, smoothed as polyline and labeled every 200 m:
| Item | Value |
|---|---|
| File | PNOA_2023_MUR_650-4257_H30_NPC02.LAZ (21 MB) |
| Points in the file | 4,834,777 |
| Points imported (cap of 1,000,000) | 966,956 |
| DTM faces | 1,931,365 |
| Contour lines (2 m interval, index every 5) | 37,903, of which 7,746 index contours, with 57 labels |
| Resulting DWG, with the cloud, the DTM and the contours | 110 MB |
In our tests, the import, the DTM and the contours took less than a minute in total. The number of contours is high for a reason you can see in the image: the cloud includes trees and buildings, and each one raises its own small “hill” in the surface. We explain it in the limitations.
After the contours
SPOTELEVATIONgives the ground elevation at any point and, with the Label option, draws it.CONTOURLABELadds labels by hand wherever you want.SURFACEANALYSIScolors the surface by slope, elevation bands or aspect, with its legend.EDITSURFACEswaps edges, adds or removes points, erases triangles and adds breaklines, boundaries or holes.LANDXMLOUTexports the DTM to LandXML.
If you do not have a point cloud, IMPORTDEM reads the CNIG grid DEMs (ASCII Grid or GeoTIFF) and
IGNDEM downloads the one for the visible area from the IGN elevation service. You can put the
orthophoto under the contours: we explain it in how to import the Spanish cadastral map and
the PNOA orthophoto into a DWG.
Limitations
- No filtering by class on import.
POINTCLOUDbrings in all the points (ground, vegetation, buildings), and the DTM triangulates them all. For a clean terrain model, start from a cloud with only the ground points, or delete the others before the DTM; coloring by class helps to see them. - Uniform subsampling. 1 out of every N points is kept, spread across the cloud, with no preference for any area. Raising the maximum gives more detail at the cost of a heavier drawing.
- One point object per point. There is no engine for billions of points: with one million points, the test DWG weighed 110 MB.
- Coordinate system via WKT. Only the system that the file stores in WKT format is recognized. In the PNOA tile we tested, the dialog box showed “none”; as it was in the same system as the drawing, no reprojection was needed.
- It does not replace fieldwork. The contours have the accuracy of the flight and of the point density you import.
Frequently asked questions
Can I import total station or GNSS points? Yes, with IMPORTPOINTS, which reads CSV
and the Leica, Sokkia, Topcon, Trimble and Carlson formats; the DTM and the contours are done the same way.
Can it be automated? LinceCAD has AutoLISP, scripts and a local API for Python: how to automate DWG drawings with Python.
What if the topographic map I have is a scan? You can vectorize it, although the contours will come out without elevations: how to vectorize a scanned drawing and convert it to DWG.
LAS/LAZ point clouds, DTMs and contour lines come as standard in LinceCAD, with a perpetual license. Download · See pricing · Topography and all other features.